Comparison Between Uber and Taxis
There has been debate about the different ride-hailing methods in New York, since Uber arrived to the city. One of the most critical topics regarded traffic congestion in the city. That concluded in a case study carried out by the NYC Taxi & Limousine Commission (TLC). Thanks to FiveThirtyEight and their request regarding the law of Freedom of Information, the Uber data used for the study became public. In doing this, they gave us the opportunity to compare NYC taxis with respect to Uber and highlight the underlying differences between these two similar but different transport methods.
First, a little explanation about the data. The taxi data was filtered for the same year, months present in the Uber dataset and then down sampled to the same number of pickups. Therefore, balancing the dataset to be able to differentiate between the different behaviour of both ride-hailing methods. Uber dataset is composed of 3 features, latitude longitude and pickup time. Therefore, we focus on those columns in the comparison with taxis.
As a starting point, one of the first interesting difference is found when the data is grouped hourly. The distribution of the pickups is quite different as we can visualise in the following image.
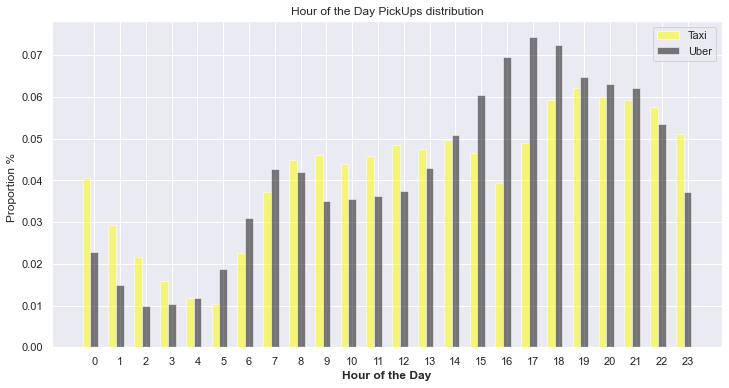
To understand what is happening in the figure we will remind the reader how Uber works. Basically, the driver chooses when to work. Therefore, it is not peculiar to see a decrease in pickups between 22:00 and 4:00, probably most of the drivers are resting. Something similar can be observed between 8:00 and 14:00. We can also see that in this window taxis increase their pickups, that is probably due to the decrease of Uber drivers working. These hours are not considered as peak hours hence the Uber drivers do not see them as interesting. However, after 14:00, Uber pickups start to increase, reaching a maximum at 17:00h. This trend is caused, mostly, by the taxis' shift change which happens at 16:00h.
When grouping the data by day of week we can see something like this.
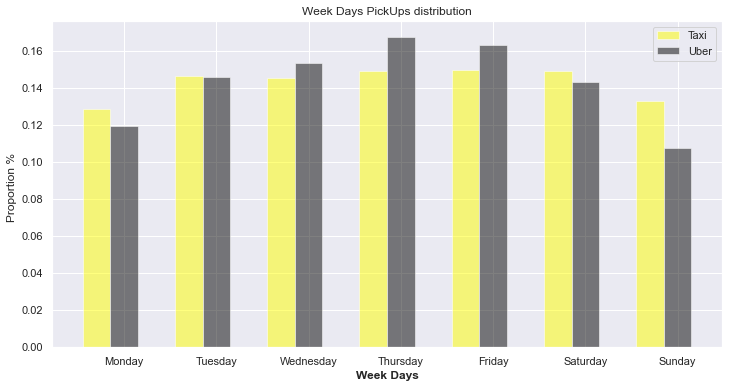
From these distributions, we can observe that the busiest day is Thursday for both taxis and Ubers. On the other hand, Uber drivers get a little bit lazier on Sunday and Monday while taxi drivers do not seem to rest too much, as their pick-up distribution is roughly constant through-out the week.
Following the same train of thought we believed it would be interesting to see the distribution of pick-ups by month, what we got is this:
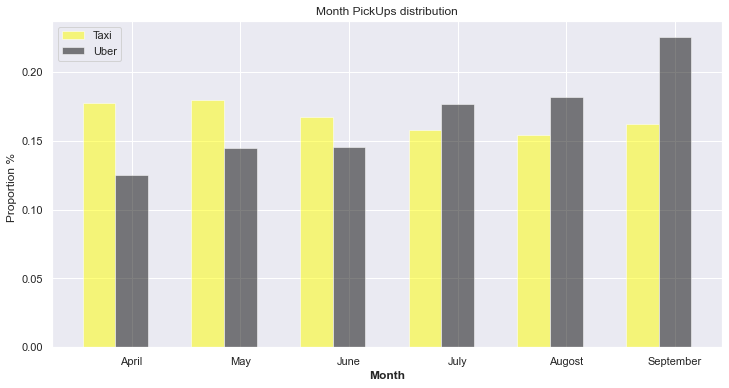
If it had been possible to also obtain data along a few years, the phenomena presented here would be more noticeable. The increase of Uber and decrease of taxis during these months is not caused by Uber cars having better air conditioning, which is the theory in support of the summer increase. What we can see is the constant decrease of the traditional taxi demand and an increase in demand of other ride-hailing companies.
To change a bit from those series of time distributions in bar figures, the distributions in the next figure are described with lines which can be visualised even showing several of them. Additionally, the figures are interactive. Being possible to select the distributions that one would like to visualise.
The distributions follow the rules highlighted in the previous analysis. Both have an increase in demand on Friday and Saturday nights and decrease around 8:00. However, Sundays change a bit on the Uber distribution. We can see an increase in the hours which we previously described as not interesting for drivers. Between 10:00 and 16:00.
After a lot of time series analysis, it is time to pass to geographical data. And the first thing that was done is plotting the coordinates of every pickup of Uber and Taxis defining the density of point with intensity of colour. The result was the following.

The blue one is the pickups from taxis while the orange belongs to the pickups of Uber. While the taxis pickups are concentrated in Manhattan, Ubers cover a bigger area and enter deeper in the areas of Brooklyn, Queens and The Bronx. Returning to the popular debate, mentioned before, about the traffic congestion of the city centre we can infer that is not totally true that Uber is causing the slowing of Manhattan streets.